In the highly competitive arena of pay-per-click (PPC) advertising, accurate profitability metrics can make or break your business.
When you know for certain which customer interactions have the most value, you can then fine-tune your PPC strategy to target your best customers and generate the most revenue—and do it consistently.
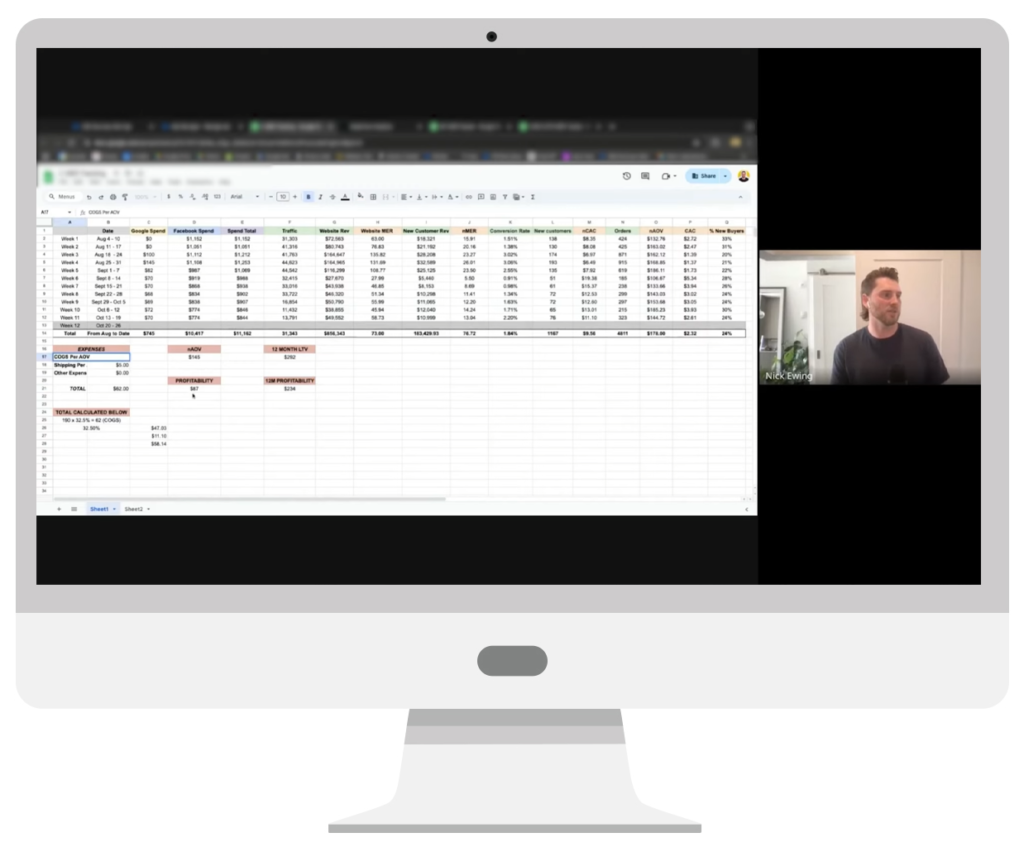
Here at Solutions 8, we are always looking for ways to better measure profitability for our clients’ PPC campaigns. Recently, our Meta Ads rock star Nick Ewing shared with our internal team a detailed media efficiency ratio (MER) tracking sheet he created to help clients analyze profitability metrics across all marketing channels and make data-driven decisions about where to allocate budget for their paid advertising campaigns.
In this video, Nick talks about why he created the sheet, how business owners and marketers can use it to track their campaigns, and the benefits it provides. You can download a copy of Nick’s MER Tracking Sheet here, and keep reading for a quick overview.
Benefit #1: Better business conversations
One of the biggest benefits of using the MER Tracking Sheet is that you can move away from using third-party attribution platforms such as Triple Whale and Northbeam. Such platforms, while helpful, may not be within the budget for smaller businesses and independent marketers.
Nick created the sheet because a client approached him and said their finance department wanted better profitability metrics, and they wanted it over the course of 12 months. And while it takes a little time to set everything up at the beginning, the effort is worth it for the value it provides.
“I’ll just go in on Monday and update all the metrics for that previous week, and it helps me get a better sense of how performance was that previous week as opposed to just looking at the ad account and saying things look good or things look bad,” says Nick.
Using a client example in the video, he explains how using the sheet gives you more talking points when going over the information with clients, as opposed to just jumping into the ad account and making assumptions about the account based on order numbers.
“I think clients can kind of gloss over when you’re talking specifically about ad account metrics,” adds Nick. “But this is more information that they can actually use at a business level.”
Basically, he says, using the sheet offers more information to share with clients, which leads to larger business conversations that allow clients to see the bigger picture in terms of ad spend, performance, and overall revenue.
Benefit #2: Smarter decision making
Having more information at your fingertips will always lead to smarter decision making, which is why our team always strives to look at a broader range of metrics from multiple sources.
In one example from the video where they did a week-to-week comparison, Nick points out that if they had looked only at in-platform return on ad spend (ROAS), they would have assumed that something was not working and that the client needed to make a change—since the ROAS had dropped from a 3.18 to a 1.9.
However, according to the global metrics provided by the MER Tracking Sheet, the week in question actually saw a $10K increase in revenue, while spending exactly the same amount.

Calculating profitability using COGS
Nick goes on to explain how using the clients’ COGS (cost of goods sold) plays a key role in helping him calculate profitability more specifically than he has in the past.
Using a copy of the MER Tracking Sheet for your business or for your clients, you can fill in the calculations for COGS per AOV (average order value), Shipping per AOV, and Other Expenses per AOV.
By using the MER Tracker Sheet to calculate the cost of goods sold, business owners and marketers can better understand performance and profitability, which in turn helps to allocate spending more efficiently. You can tune in here for a more detailed conversation about COGS.
A word about DataDrew
While you may not update the MER Tracking Sheet every week, Nick says it is good to have on hand and available just in case the client wants additional information. And, if you want to look at things on a broader time frame, you can look at customer lifetime value (LTV) as well.
Although this information and other additional data can be found using more expensive third-party platforms, you don’t necessarily need them. Nick has been using an alternative called DataDrew, which uses the client’s immediate Shopify information to deliver very topline metrics. Clients can easily install DataDrew on their website for about $40 monthly—as opposed to the hundreds or thousands of dollars per month you might spend with other apps. (You can even remove it after the 7-day free trial and pay nothing.)
Among its many cool features, the analytics platform provides a helpful Basket Analysis, which allows you to see which products are purchased most frequently in conjunction with each other. In theory, you could use that information to create high-performing product bundles to drive website purchases.
Another feature Nick finds helpful is the Repurchase Rate, which identifies the products that are most frequently purchased by new customers, and which also lead to a high repurchasing rate of other products. So, if you are targeting new customer acquisition for example, expanding on those products throughout the imagery and different product pushes on social could be a lucrative avenue to pursue.

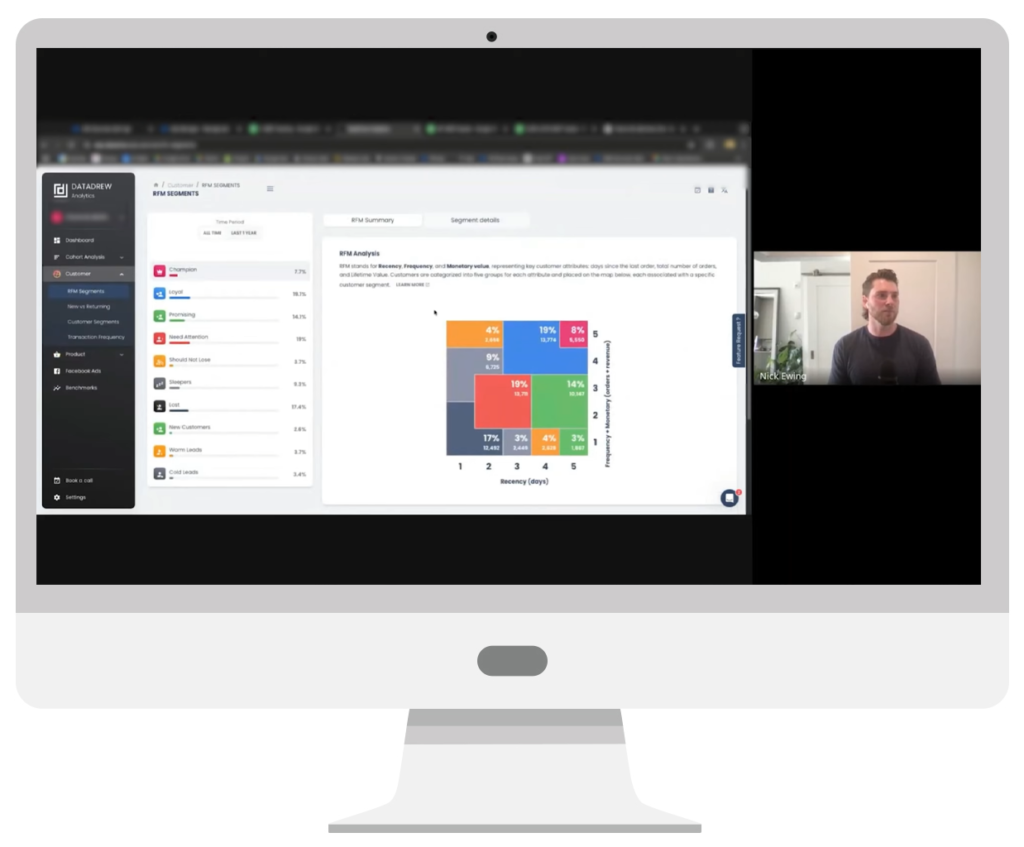
Finally, under the Customer tab, DataDrew has a feature that breaks down your entire customer list into the following segments: Champion, Loyal, Promising, Need Attention, Should Not Lose, Sleepers, Lost, New Customers, Warm Leads, Cold Leads.
The Champion segment (people who have spent the most, and most frequently) and Loyal segment (people who spend often and in good amounts) represent their best audiences, which Nick then uses to create lookalike audiences to further drive revenue.
The Should Not Lose segment represents people that made high purchases in the past but have slowed down recently. Nick explains that this is a great opportunity for email marketing; you can connect to Klaviyo (or export from another platform such as MailChimp) and re-engage with those past purchasers with a new offer to make them part of the Champion segment again.
Why download the MER Tracking Sheet?
As our Client Manager Jason MacLean put it, “It takes you four or five minutes to update the sheet every week but other than that, you’ve got a lot of data at your fingertips.”
And the more time you spend doing it, the more insight you will gain about what’s working and what’s not. You will start to see trends emerge, and from there you will be better equipped to make data-driven decisions that ultimately lead to consistent revenue and growth for your business or your clients.
Author
Patience is the former director of marketing and communications for Solutions 8. A phenomenal content writer, copywriter, editor, and marketer, she has played a prominent role in helping Solutions 8 become an authority in the Google Ads space. Patience is also the co-author of The Ultimate Guide to Choosing the Best Google Ads Agency and You vs Google.
 Patience Hurlburt-Lawton
