 Patience Hurlburt-Lawton
If you’ve ever struggled to piece together the full story of how new and returning customers differ for your Shopify store, read on! One of our dedicated Account Managers, Frank Schaefer, shares his three favorite reports for diving deep into these critical metrics that will help you understand customer behavior in Shopify.
Table of Contents
Default New vs. Returning Customer Report
Default New vs. Returning Customer Report
This report is one of the cornerstones of Frank’s marketing efforts. You need to know the number of new customers you’re acquiring and how many become a loyal return customer to calculate important metrics such as customer acquisition cost (CAC) and determine the success of your paid ads.

It is the standard one you can set up by product to understand the consumer behavior metrics accompanying it. Let’s take a look at the default Shopify report and the changes that you can make to it that suit your needs.
Under analytics on the left side of the screen, click reports. The report we want is first-time versus returning customer sales. If it doesn’t come up, type it into the search bar.
Open the report and you’ll find a graph displaying the number of orders and the number of first-time and returning customers for the period you select. By selecting none, you get rid of the graph and have a clear view of the information most useful to you.
In this case, Frank has chosen the last month and it shows the orders and total sales.
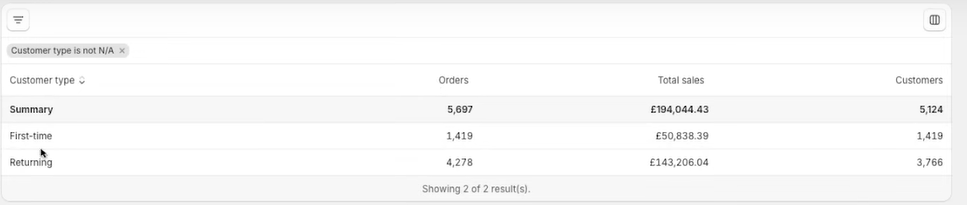
As you can see, the first-time customers align perfectly with the number of orders. However, there is a discrepancy between returning customers and additional orders for last month.
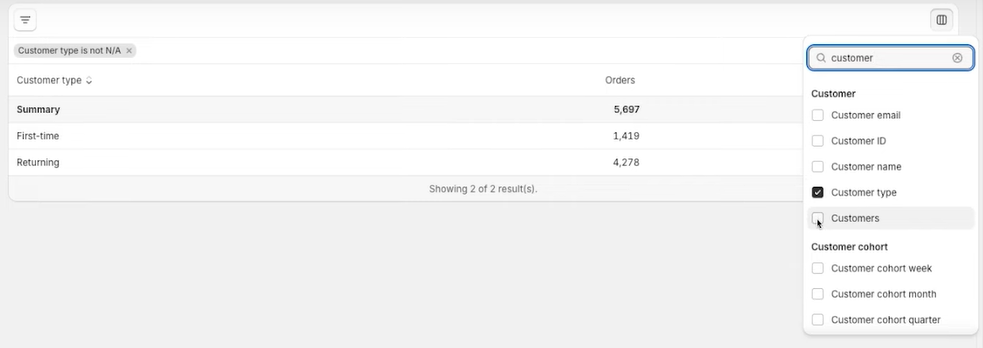
The customer column allows us to see the additional orders from returning customers. Further lists can help us narrow down the exact figures. There is a save option to keep the setup to your liking, every time you go into the customer report.
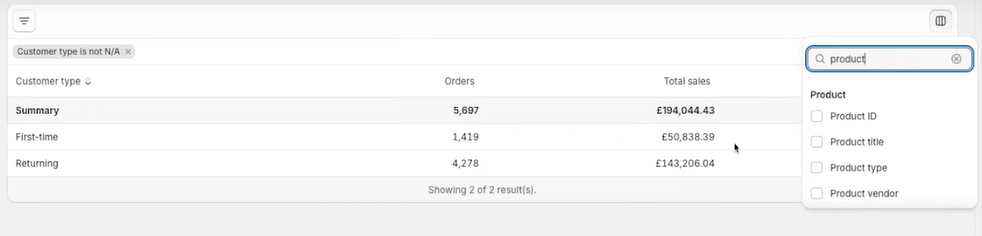
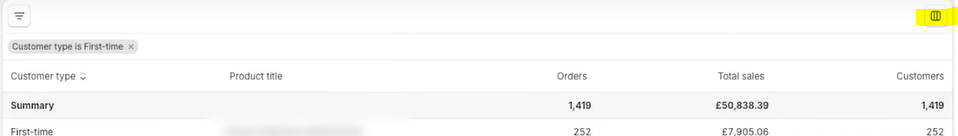
This next column gives us a view of first-time and returning customers by product. It also allows us to identify a product that is especially successful in drawing in new customers, which is what we’re after in paid acquisitions.
A product title is useful for small stores. This is the breakdown of first-time and returning customers by each product in your Shopify store.
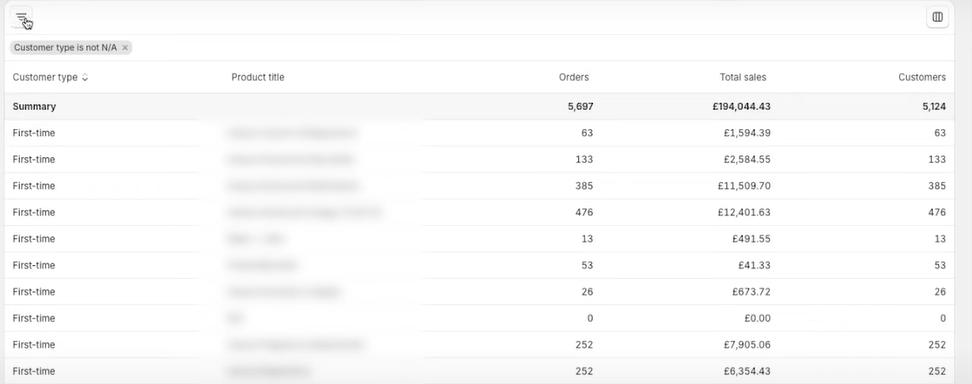
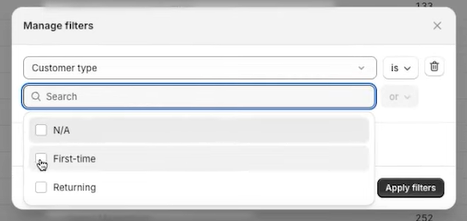
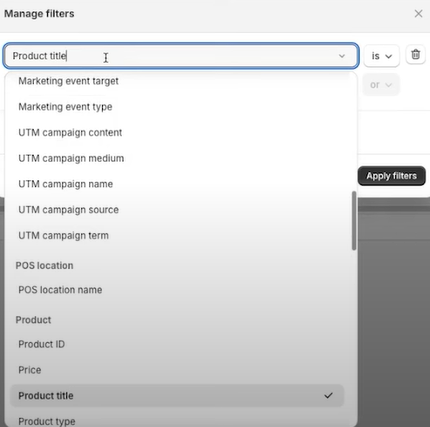
When the list of product titles is particularly long, you might want to refine it. If you go to the icon on the top left corner of your screen, you can use the filter icon to choose either first-time or returning customers. Click ‘is’ and then the selection you want, followed by ‘Apply filters’.
If you wish to reduce the number of columns at any time, just click on the icon at the top right of your screen. You can remove product titles or orders easily.
If you have the report set up exactly as you like it, click the ‘save as’ button in the top right corner of your screen, and then name the report to access it whenever you need it.
Congratulations! You have successfully customized your amazing first report!
New vs. Returning Customer Average Order Value (AOV) Report
The next report is one of Frank’s favorites. It is AOV by Customer Type. Ever wondered what the buying habits of your first-time vs. returning customers look like? This report will give you a TON of insights.
Understanding AOV for different customer types is important for your eCommerce journey. Understanding AOVs helps you fully comprehend the customer journey and the drivers of customer lifetime value (LTV).
To build this report, go to the dashboard, click ‘Analytics’, and then click ‘view Report’. We start here simply because we like this base template and it saves time in the long run.
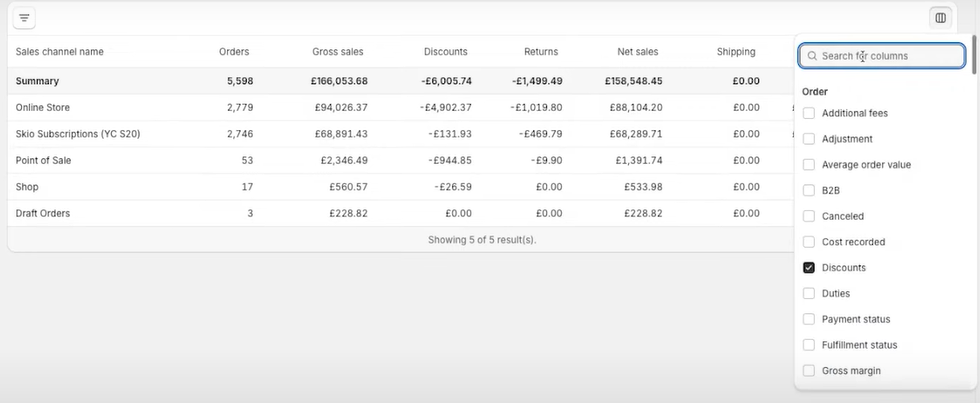
From here, click on the column button and tick the box next to ‘discounts’, ‘average order value’, ‘customer type’, ‘customers’, ‘average units ordered’, and anything else you’d like. Then, click ‘save as’ to come back later!
You now have a breakdown of your new versus returning customers with the option to add a time frame. Here you can compare and contrast the AOV and highlight the differences between returning and first-time customers.
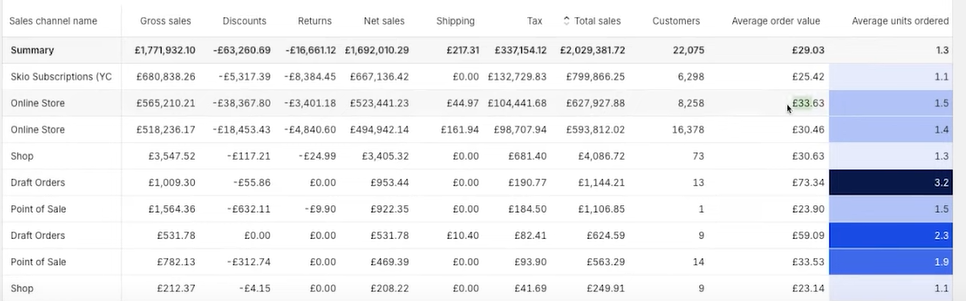
Any special offers that you run may skew new customer AOV slightly higher. One of Frank’s clients has a shipping threshold, and it is the new customers that take advantage.
Please remember it is also possible to filter out certain products to view the AOV of a certain line or category in your store. It’s easy enough to do. By opening up the filter icon, search for a product title, and select the product in the dropdown to see the AOV of your specific product.
New vs. Returning Customers by Sales Channel Report
The last report we will build is the customer type by sales channel. It’s a valid and useful report if you have multiple sales channels. It is convenient when you want to define the breakdown between new and returning customers in your POS system for instance.
Sales channels are not differentiated in the default template report. This last report gives us the chance to see which sales channel they originated from. To create this report, go to the dashboard, click ‘Analytics’, and then click ‘View Report’.
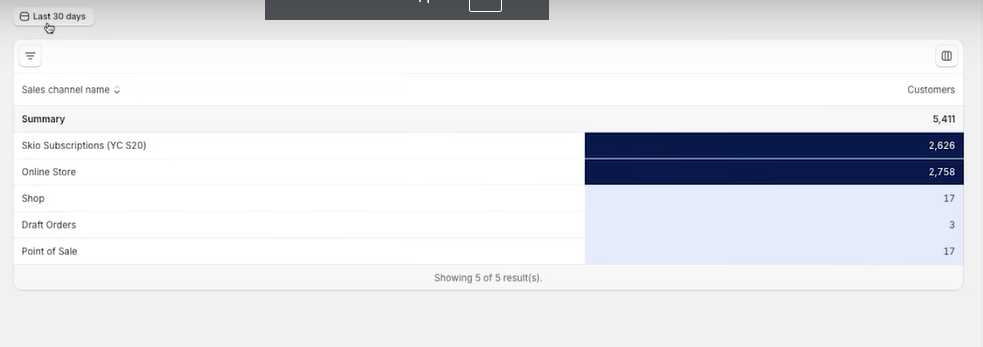
Ideally, we remove all the columns from the default template leaving just the time period, the sales channel name, and the number of customers as shown above.
One of Frank’s clients sells online and through a retail store. They were experiencing a decline in new customers and couldn’t pinpoint whether this stemmed from the online or retail channel.
This report resolved the issue clearly, outlining the POS system, the online store, its integration with Meta, and which channel drove new customer growth month by month. What a way to keep on top of your strategies!

That is what we have for you today. Our team of brilliant digital marketing minds puts content like this together every week, so follow us at Solutions 8 for more information!
Author
Patience is the former director of marketing and communications for Solutions 8. A phenomenal content writer, copywriter, editor, and marketer, she has played a prominent role in helping Solutions 8 become an authority in the Google Ads space. Patience is also the co-author of The Ultimate Guide to Choosing the Best Google Ads Agency and You vs Google.