We’ll be honest:
That’s an impossible question to answer. But hold tight—because we’re going to show you how to determine your average CPC.
And once you have that data, you can use it to figure out whether your business is viable or not by using our Free Estimates and Projections Tool.
And you no longer need to ask yourself “can THIS work?”
By the end of this tutorial, you’ll be armed with not only knowledge but also the data that will give you more confidence to make the right decisions–either for you or your client’s business.
Want a Permanent Copy?
Download the Guide on How to Build Estimates and Performance Projections for Google Ads Campaigns
How to Get Your Average CPC
This process is specifically geared towards agencies who handle multiple accounts. Here’s how to do it:
- Go to your Google Ads account and select Campaigns.
- Add a filter that only shows all your Smart Shopping Campaigns and make sure that the currency is in USD (or whatever currency you’re using).
- Select a custom timeline. Ideally, that’s 1-2 years. But if you’ve only been running ads for less than a year, choose the longest time period in your history.
- Once it’s sorted out, look at the average cost column, it should show you your average CPC.
Just a quick disclaimer. The average CPC you’ll get might not be 100% accurate. But it’s a reasonably good number to start with.
Now that you know your average CPC, it’s time to find out how profitable your business is.
Getting Set Up
Open the estimates and projections tool. Once inside, you’ll notice there are two tabs “lead generation” and “eCommerce.”
Lead Generation is for service-based businesses (e.g. doctors, lawyers, dentists, agencies).
ECommerce is for selling products, whether online or physical (if you’re a SaaS, you should use this too).
Select the relevant tab to your business type.
Determining Your Net Values
Before filling out the estimates and projections tool, you should already know your Average Initial Order or Average Order Value (AOV) and Average Lifetime Customer Value (CLTV).
Take note that you need to get the ‘net’ value of both, not the gross value. This helps you determine your actual profitability.
Here’s a Simple Formula to Get Your Net Values:
Net Average Initial Order = Average Initial Order x profit margin
Net Average Lifetime Customer value = Average Lifetime Customer Value x profit margin
For example: Let’s say your Average Initial Order is $75, your Average Lifetime Customer Value is $1,000, and your profit margin is 20%. Using the formula above, here’s what you’ll get:
Net Average Initial Order = $75 x .20 = $15
Net Average Lifetime Customer Value = $1,000 x .20 = $200
Pro Tip: If you don’t know your Average Lifetime Customer Value, just double your Average Initial Order for now and edit it later once you have more reliable data. You can also look at your repeat rate and calculate the average.
Now, if you’re selling low-dollar products and your customers only buy from you once (e.g. cell phone cases), you might want to consider changing businesses. It would be hard to achieve profitability if your customers don’t purchase repeatedly.
Data Fields
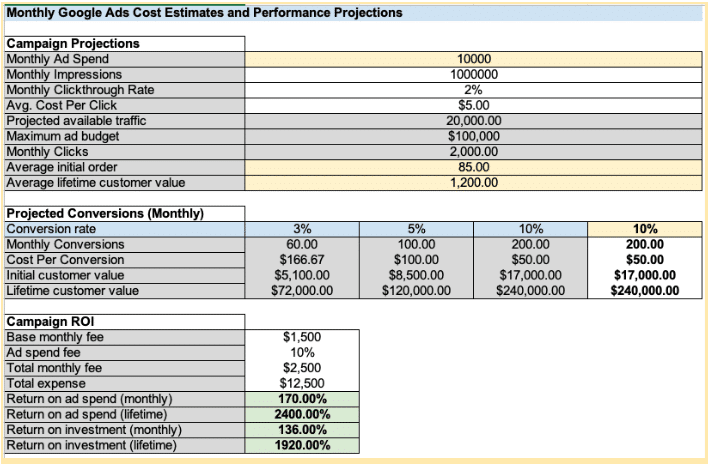
The tool is already filled out with sample data; however, since your business may be different, you’ll likely delete the input fields and start from scratch. The photos used in this tutorial will have blank fields.
White-colored fields: you can play around with it
Yellow-colored fields: most important fields
Grey-colored fields: don’t put anything here as they’re formulaic and auto-calculated based on what you input in the white and yellow fields.
Let’s get started!
Campaign Projections Section

Monthly Impressions:
How much available traffic exists for your targeted keywords?
Write down the estimated amount of traffic available for your target keywords here.
Monthly Clickthrough Rate:
What is the percentage of people projected to click on your ads?
The average click-through rate on Google Ads (AdWords) is about 2%. If you have any historical data about your clickthrough rate (CTR), you can use that number here.
There are some industries that have a higher CTR (e.g. emergency plumbers, dating, etc) but it’s advisable to use 2% for now. Don’t worry too much about this. Just remember that it won’t impact how much your leads will cost. It will only impact the amount of traffic that’s available to you.
Avg. Cost Per Click
What is the estimated average of CPC across all your keywords?
Remember the ballpark figure of the Average CPC we talked about earlier? Put it here.
However, if you don’t have that data yet, you can always check Google Keyword Planner. Look at your low-end and high-end top page bids and get the average.
Based on the numbers you enter in Monthly Impressions, Monthly Clickthrough Rate and Avg. CPC. You should be able to see the projected available traffic as well as the maximum ad budget (highlighted in Grey).
Monthly Ad Spend (Yellow)
How much is your projected monthly ad spend?
Now that you have an idea of your Maximum Ad Budget, you can base it off of that and enter your projected Monthly Ad Spend here.
Average Initial Order (Yellow)
Your Avg. Initial Order might look low especially if you’re selling a one-time service or product. The important thing to note is it should give a better ROI if you have a good Avg. LCV retaining customers (for service-based offers) or you’re upselling/cross-selling other products (for eCommerce/Saas)
Projected Conversions (Monthly)

Conversion Rate
How many people who clicked through the ad will actually turn into leads?
If you have historical data to back this up, use that number. Otherwise, since we’re just exploring (and to be on the safer side) enter at least 5%.
Campaign ROI

Base monthly fee
Plug in your gross Average Initial Order here.
Ad Spend Fee
This means any fees that you charge on top of the service or product you’re selling. If you’re an agency, put the percentage of your agency fee.
Total Monthly Fee
No need to put anything here as this automatically calculates your base monthly fee plus ad spend fee.
Total Expense
No need to put anything here since this automatically calculates your monthly ad spend plus total monthly fee.
What are considered good numbers?
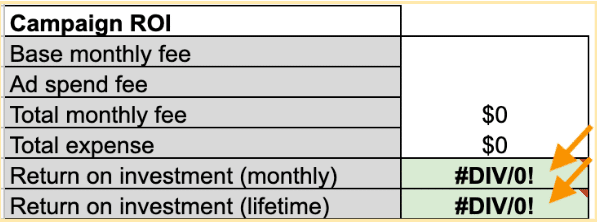
Once you’ve calculated your numbers, look at the fields “return on investment (monthly)” and “return on investment (lifetime).” Again, these are based on the numbers you put in the previous fields that we’ve gone through.
Return on investment (monthly)
If it’s below 100%, that doesn’t mean you’re not making a profit. As long as your lifetime return on investment is significantly higher (meaning you’re retaining clients or upselling/cross-selling other products), you should be doing well.
Return on investment (lifetime)
Anything above 100% means you’re making profits. Anything above 300% is really good.
If you’re not seeing the profits you want to make, that’s fine. This tool’s purpose is to help you identify any opportunities you’re missing and help you know where you can make those improvements. So go back to each field and find out what you can tweak to make your Campaign ROI better.
Are you a lead generation business?
This process is the same for lead generation. The only difference is there’s no “Projected Profitability” section—this is because in eCommerce, people usually either buy or they don’t. There are no follow-up or sales calls to be made so there’s no reason to project a closing rate.
Just remember, if your average initial order is low, but your average lifetime customer value is high, you should see a good overall ROI (lifetime).
Author
Bryan is the marketing manager at Solutions 8, and has been on digital marketing since 2018. When he’s not working, you’ll find him working out at a local gym, reading personal development books, or playing music at home. He feels weird writing about himself in third person.
 Bryan Caranto

