 Patience Hurlburt-Lawton
You probably heard that ROAS is not the most important metric for tracking your ads’ performance. Some people even go as far as saying it’s a vanity metric.
While we understand that it’s a good indicator of your success, it doesn’t tell you the whole story.
When it comes to measuring your SKU performance, you’ll have to look at the bigger picture.
In this post, we’ll talk about how to measure your SKU performance and the factors that you need to consider to get more accurate data.
Table of Contents
Why You Shouldn’t Base Your Profitability in ROAS Alone
How to Measure Your SKU Performance
Comparing Google Ads ROAS and Conversion Value in Google Analytics
CAC vs ROAS
Cross Pollination With Other Google Ads Campaigns
Conclusion
Why You Shouldn’t Base Your Profitability in ROAS Alone
ROAS or Return on Ad Spend has always been a good indicator of performance in paid advertising. That’s why we created a ROAS calculator here.
However, looking at ROAS alone can be an inaccurate way to measure your overall revenue.
You can get a high ROAS but if you’re spending a lot of money on repeat customers, then a great ROAS doesn’t matter that much.
See, your customers could be coming from social media, blogs, emails, and other marketing channels. Measuring your SKU performance using only one metric isn’t showing you the whole picture of what’s actually happening.
After all, not everyone is going to click on an ad and buy. Here’s what usually happens before they buy:
- They click on an ad and land on your site
- They leave your site
- They change devices
- They Google your brand name and click on your site
- Look for the product they clicked before
Any of these things can happen before a customer converts. That’s why it’s important to check your data using different tools—Google Ads, Google Analytics, and platforms like Northbeam.
How to Measure Your SKU Performance
To illustrate, let’s look at this campaign.
This is a Performance Max campaign with only one SKU. We’re driving a very specific product to a very specific product page.
From May 1st until May 31st, you can see that we had 248,847.00 conversion value and 292,204.56 conversion value (by conv. time).
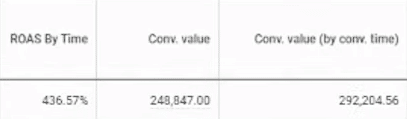
These two numbers are different because conv. value shows clicks that converted within the same period. Learn more about conversion value by time here.
And our ROAS is 436.57%.
Everything looks good. But when we looked at Google Analytics, we saw a different number.
Comparing Google Ads ROAS and Conversion Value in Google Analytics
To see our Google Ads data in Google Analytics, we segmented the channel by “Google / cpc.”
This means we’re not considering other channels like Microsoft Advertising (Bing), Facebook, Instagram, and other social media platforms. It’s only coming from Google Ads.

Remember, our conversion is 292,204.56.
But in Google Analytics, our product revenue is $680,652.43.
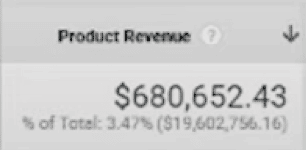
That’s more than twice the revenue we saw inside Google Ads!
This means our ROAS should’ve been at least 700%. So what exactly happened after they clicked?
CAC vs ROAS
There’s a lot of factors that contribute to your campaigns’ success—ROAS, Lifetime Value (LTV), cross-pollination, and other channels. But one of the most important factors, yet often overlooked, is Customer Acquisition Cost or the cost of acquiring a new customer.
How much do you spend to acquire a new customer?
Say you’re spending $100 to get a new customer and $3 for repeat customers.
If your customer’s LTV is $200, then whether your ROAS is 400% or 700%, it won’t matter. As long as your CAC is less than your customer’s LTV, you’ll have a very scalable campaign.
But what happens if you’re getting more new customers than repeat?
Your ROAS will probably go down. But if your CAC and LTV stay the same, then you’re still making money.
Don’t know how to calculate your CAC and LTV? Polar Analytics has a free calculator you can use.
Cross Pollination With Other Google Ads Campaigns
Another thing you have to consider is what the customer bought after clicking your ad.
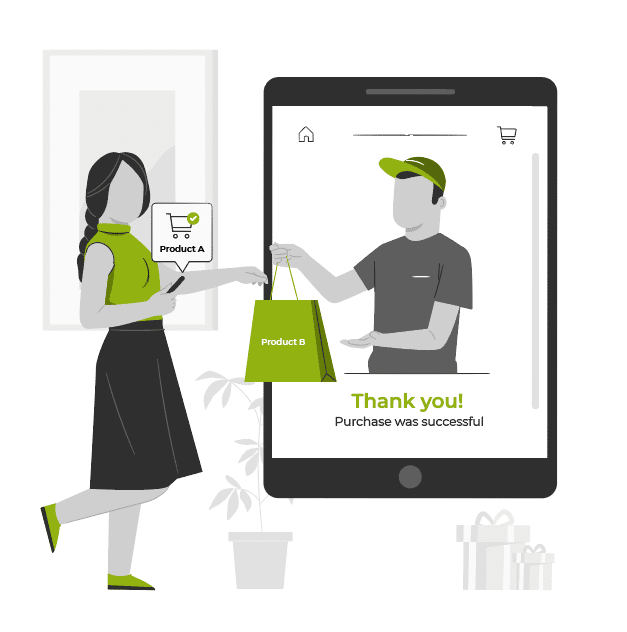
Just because a customer clicks on an ad doesn’t mean they’ll buy the product you’re advertising. Sometimes, they end up buying a different product—maybe even something you weren’t trying to sell.
If Product A got the click but Product B got the sale, Google will still attribute that sale to product A. And now, you’re getting false positives.
Conclusion
Your ROAS is a good KPI but it’s not the be-all and end-all of measuring your campaigns’ performance.
You can have a low ROAS but with a great CAC and LTV, you can be very successful and profitable.
Now, if you’re interested in diving in, check out our video on why A High ROAS Doesn’t Always Equal Success.
But if you have no time to learn all this and you’d rather have someone help you with Google ADs, then we’d love to hear from you!
Check out our pricing calculator and find out how much it takes to grow and scale your business!

Author
Patience is the former director of marketing and communications for Solutions 8. A phenomenal content writer, copywriter, editor, and marketer, she has played a prominent role in helping Solutions 8 become an authority in the Google Ads space. Patience is also the co-author of The Ultimate Guide to Choosing the Best Google Ads Agency and You vs Google.